Are KLCC condos near malls worth more?
Given the propensity of some Malaysians to shop til they drop, it is intuitive to expect properties near malls to command a price premium over those who do not. But properties next to international schools are not so popular. It is intuitive to expect a price discount because of the noise pollution arising from traffic congestion in the mornings when the little darlings are dropped off by their doting parents.
My 64 million ringgit question is: Has anybody been brave enough to quantify the effect on property prices and rentals of their proximity to shopping centres and malls, cemeteries, hospitals, police stations, parks and greenery, and international schools?
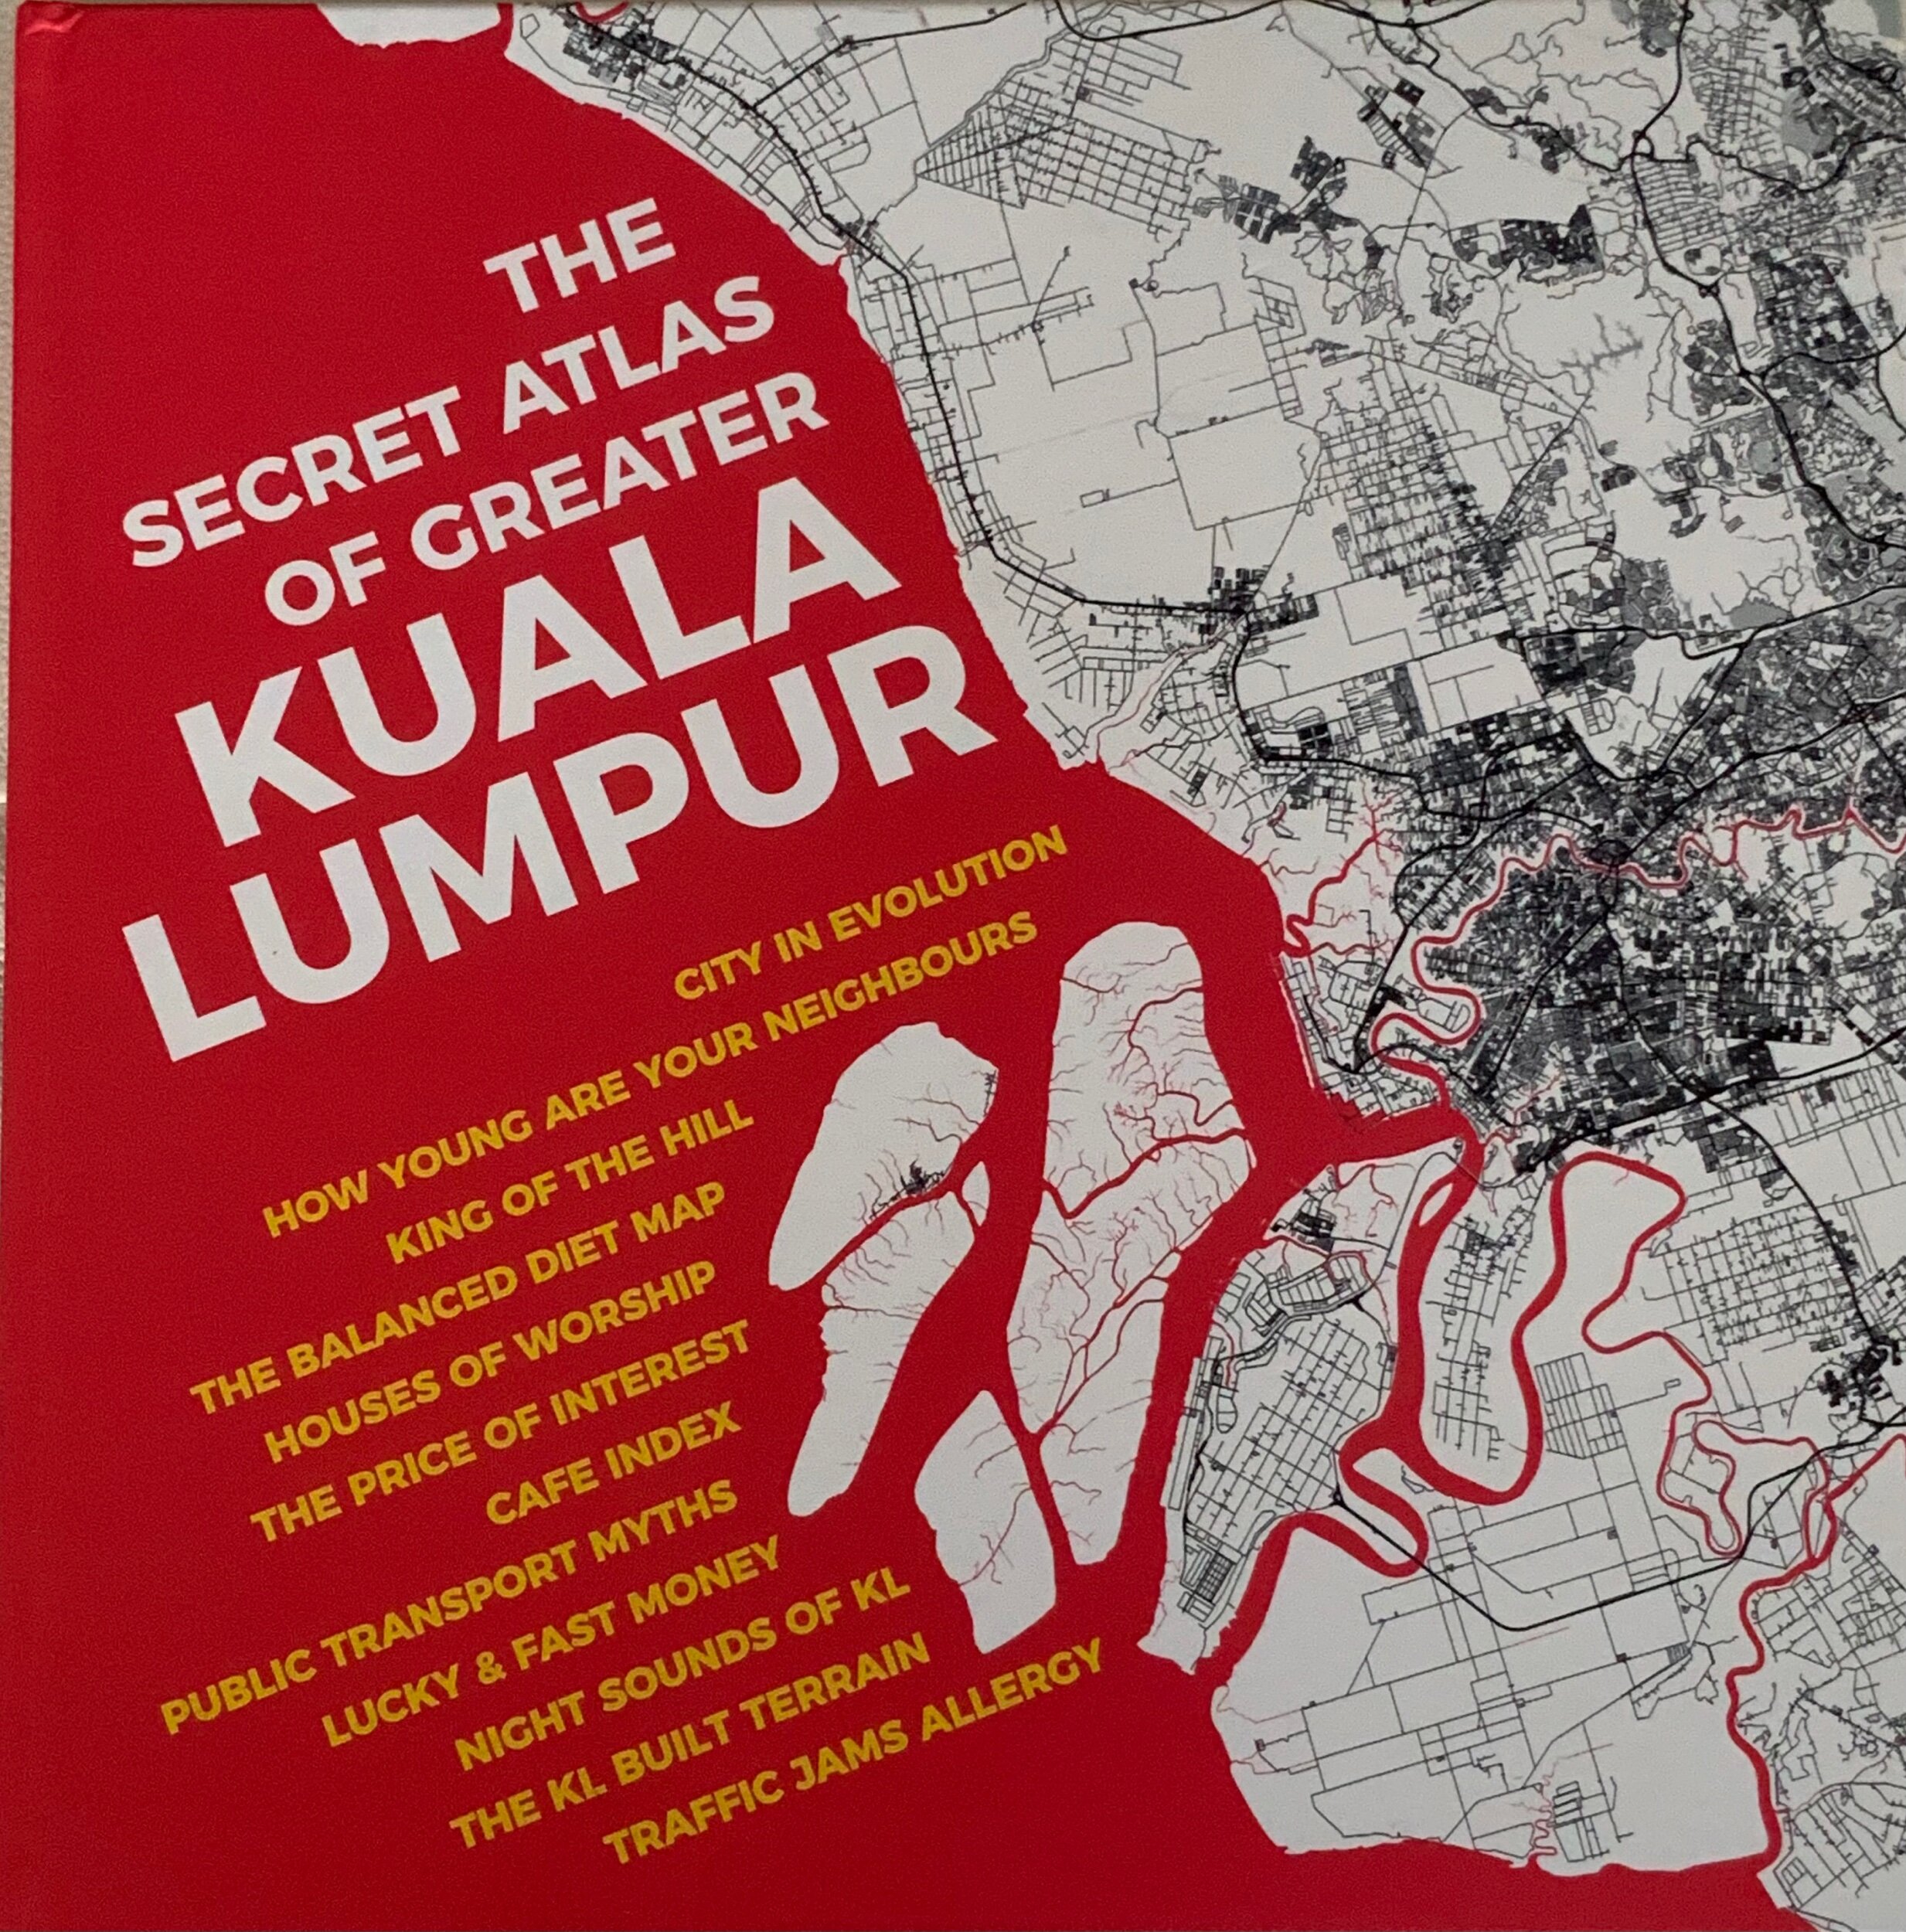
The answers to these perplexing questions are handily addressed in a large format hardback of just 88 pages by Cha-Ly Koh, a MIT trained city planner & founder of Urban Metry. Published in 2017, Ms Koh’s book has the tantalising title of The Secret Atlas of Greater KL. So what secrets have been revealed by data mining price data with geographic data?
First I think It is salutatory to note Ms Koh is CEO and founder of a company that harvests huge amounts of city data, feeds them into proprietary algorithms then churns out insights for policy making etc. The end result of data mining tons of historical price data and geographic data are cleverly illustrated by maps and histograms designed by Goh Pei Yi. Taking into account her training and qualifications in city planning, Ms Koh’s findings have credibility.
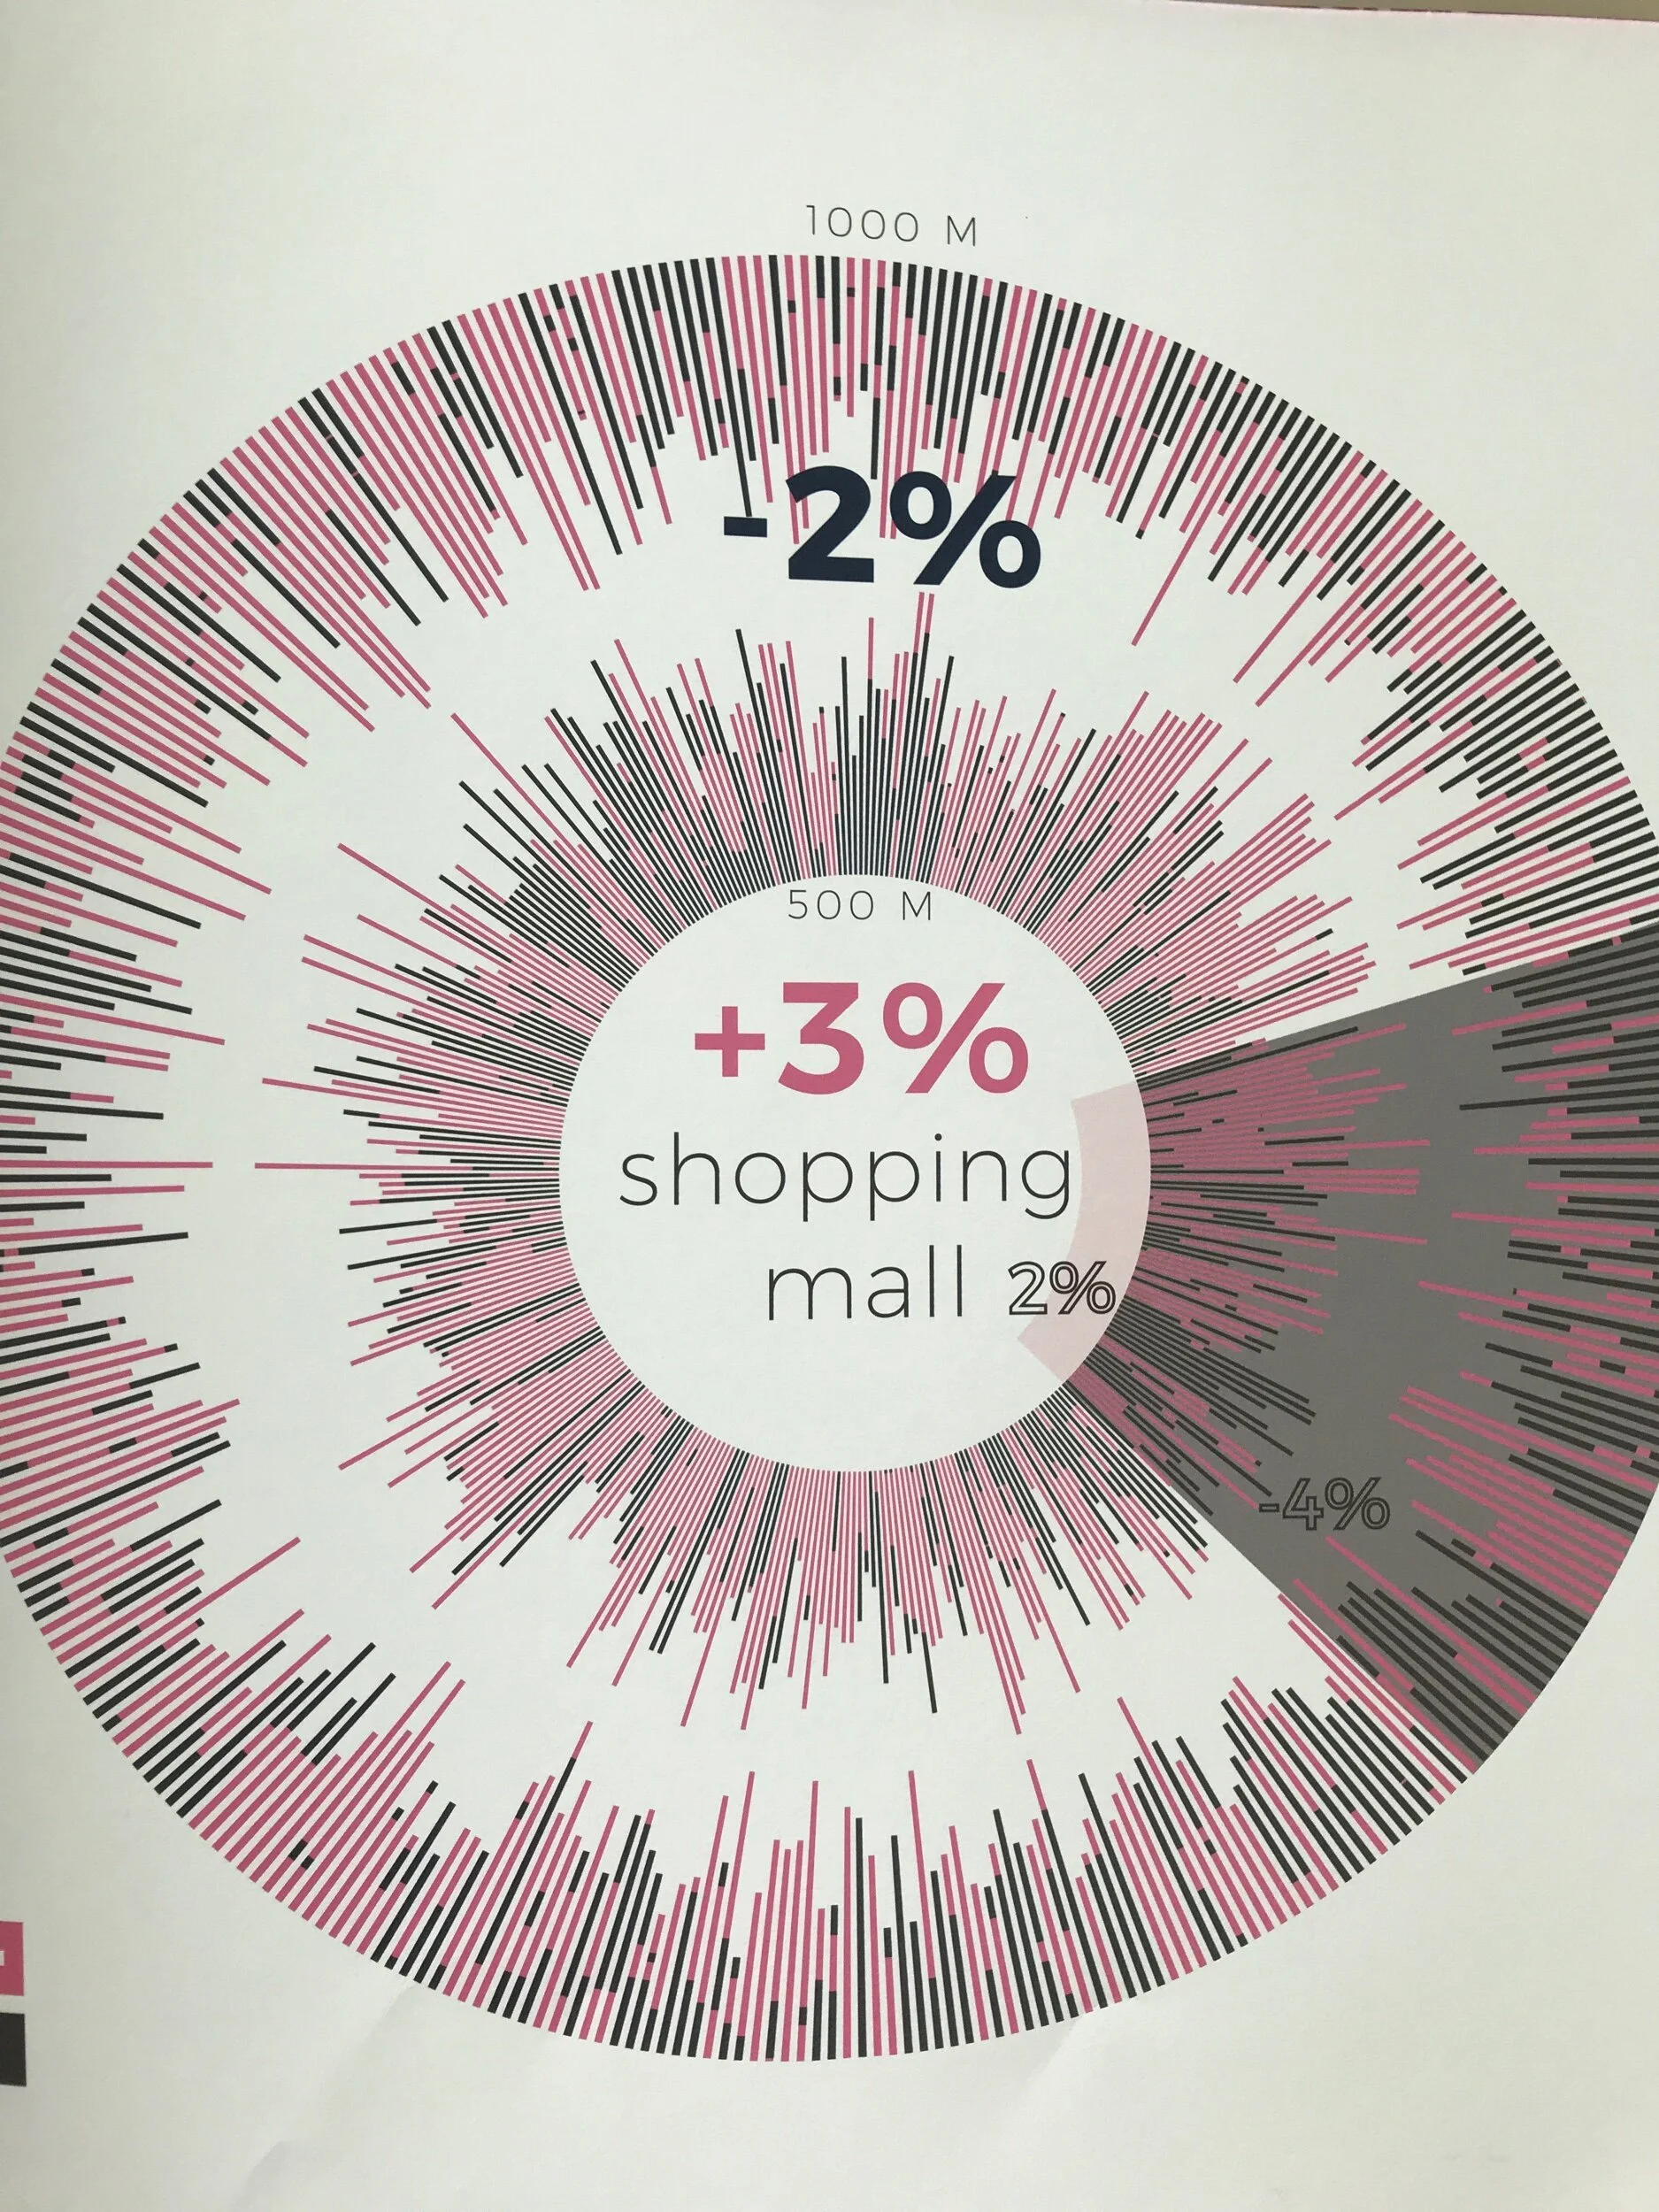
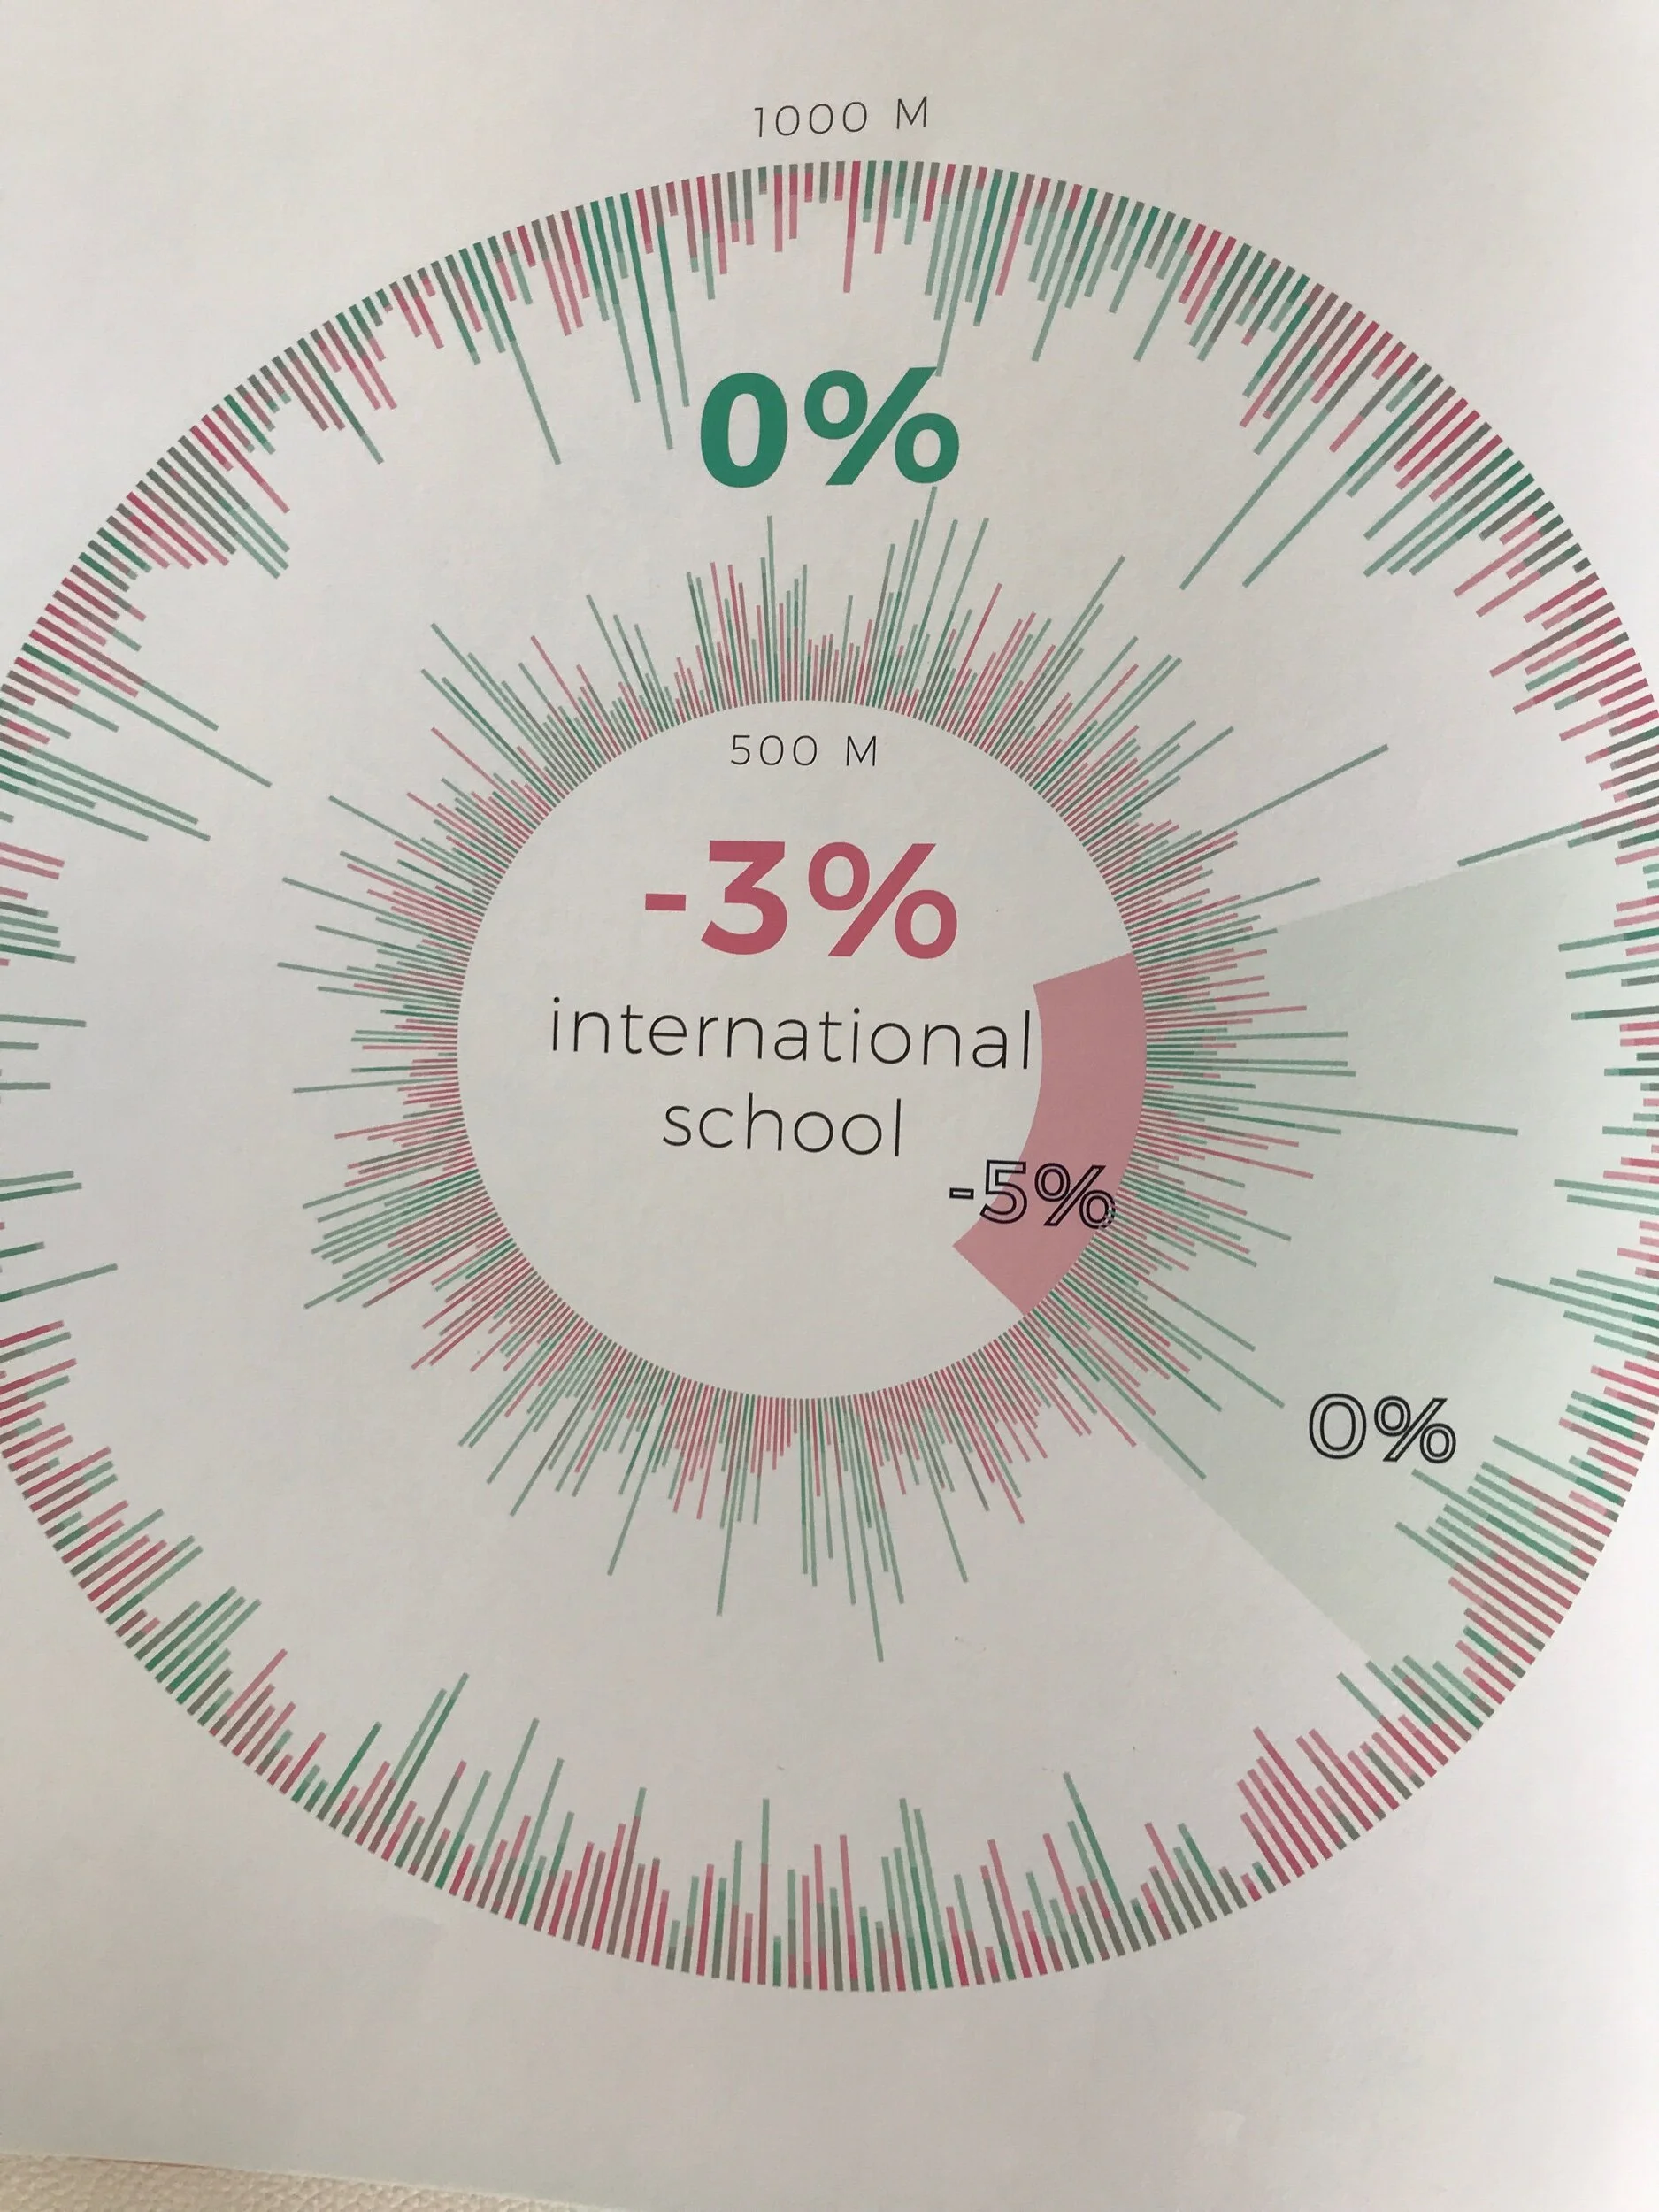
I show two histograms below for properties located within 500m and 1000m of shopping malls and international schools in the Greater KL region. The figures to note are in the centre of the histogram - these show a price premium or discount, and shown in slight offset are the corresponding figures showing rental premiums or discounts. The pictorial nature of histograms makes it easy to understand at one glance what they mean.
There is an important caveat here: It’s easy to understand for folks that have knowledge of some basic maths, basic geometry and who feel comfortable around numbers.
For those people who are data challenged: if your property is within 500m of a shopping centre, it’s worth an average 3% more compared to properties further away. Rentals will fetch an average 2% more compared to properties further away.
So you lucked out if your condo is next to SURIA KLCC or Pavilion. But the opposite is true if your property is within 500m of an international school. Too bad for those staying close to ISKL (unless you have children attending ISKL!)
Ms Koh’s book also explodes some popular urban myths regarding property price trends for apartments near completed stations along the MTR and LRT - while she notes there is some positive impact, the increase in prices is insignificant. Of course an important caveat should be noted. These price effects refer to 2015. A lot could have changed since then as ridership on the MTR networks mature. Perhaps it’s time for a Volume 2 update?
Less mathematically inclined readers might want to skip the section below:
The histograms show the MEDIAN effect of proximity to shopping centres/malls and international schools on property prices and rentals within 500 metres and another radius of 1000m. A layman will interpret the MEDIAN as 50% of results will be higher than the MEDIAN, 50% will be lower than the MEDIAN.
But in many instances where such statistics are compiled, the distribution on the right is not quite the same as on the left. Take the impact of shopping centres and malls as an example. The possible values on the left side will range from negative (ie. a discount) to 0-3%. But the right side is often skewed out in what is usually called a long tail distribution. In simple terms and taking the shopping mall histogram as an example, the median positive impact of a property within 500m of a mall might be 3% higher for a chosen sample size but there might be outliers where the positive price impact is much much greater for some UPMARKET malls. So unless one can persuade Ms Koh to provide data sets for properties in prime KL districts like KLCC and Bangsar, you will never know if the positive effect on properties in prime KLCC or Bangsar is greater than the 3% for ALL malls.
In statistics, the accuracy of an observation is shown by whether it is within the bounds of 95% confidence level bands. So, does the finding of a median of a 3% positive impact on property prices due to proximity to malls within a 95% confidence level? We don’t know. Perhaps the 95% confidence levels were intentionally left out because the target market of the book is the man in Petaling Street aka the Kuala Lumpur version of the man on the Clapham omnibus. No need to pile on more statistical jargon that the average reader might not understand.
The dangers of narrowly interpreting data based on the MEDIAN is highlighted by an essay written by Stephen Jay Gould, a Harvard Professor of Biology. He wrote 300 essays for a scientific magazine at the rate of one essay per month for decades, a remarkable feat unlikely to be repeated in my lifetime. Gould’s essay “ The Median Isn’t The Message” was written a couple of years after he was told the median mortality rate for his cancer diagnosed when he was 40 was just 8 months. Luckily as a biologist with some knowledge of statistics, he knew enough about the difference between median and the distribution around the median. As it turned out his cancer had a long tail distribution and Gould lived another 20 years of a productive life, dying at the age of 60 in 2002.
Disclaimer: I bought my 2017 copy of the Secret Atlas of Greater KL from Times Publishing for RM118 less a 10% discount for cardholders of Times.
For availability of The Secret Atlas of Greater KL see here : https://www.timesbookstores.com.my/Books/BookDetails/9789671488102
FOR MORE INFORMATION ON URBAN METRY click here: https://www.urbanmetry.com/
Copyright Cha-Ly Koh
The Secret Atlas of Greater KL 2016
Reply from book's author:
Hi Raymond,
First and foremost, thank you for purchasing the book and writing a review for us. We are really very happy that you have taken the time to do so.
Just a couple of notes that perhaps wasn't clear on the first read:
1. For the halal and non-halal nasi lemak map, we do include all foods priced under RM 10 ..edited…
2. You are absolutely right that the median doesn't tell the whole story and clearly distributions matter. We considered the complexity of these to the laymen (who is the intended audience here) and didn't want to lose them in over complication. Most often, people make these general rules of thumb in a binary manner and we wanted to show that even when they do that, the urban myths are not always true. The intention was really for the general audience to examine numbers and assumptions more carefully but we do agree that median is merely a start to examine the numbers.
Thanks again for reading.
We will be releasing a set of webinars of stats and technology we build behind all the data soon. If you are interested, we are happy to include you in the invites for these events.
Have a great week ahead.
Best,
Cha-Ly